Enlarge any chart by clicking on it.

Unless otherwise specified, ALWAYS use the 15min chart to enter my recommended plays because
CONFIRMATION is a MUST.
In other words, you need to see a 15min candlestick that CLOSES beyond
the entry point, then enter when it moves 10cents after the high/low of that candlestick.

Monday, October 31, 2011

S&P 500......

SPX-DAILY

SPX-30MIN LONGER TIMEFRAME

SPX-30MIN SHORTER TIMEFRAME

Saturday, October 29, 2011

SPX WEEKEND REVIEW (5 charts)

In my opinion, the reason this month is the biggest percentage gain since 1974 and the 9th biggest percentage gain of all time is not because anything special happened in the economic. As a matter of fact, the economic data were coming out bad when the rally started (but have been looking better recently), serious talks of another recession and Europe debt problem was still the elephant in the room. The reason for the rise was because the sharp drop that occurred from late July till early August was an artificial move caused by congress playing stupid politics with the economy/market about raising the debt ceiling thereby sending shock wave in the market by creating uncertainty. It was not a real (technical) move. As a result, we see this strong bounce to compensate for the market shock. Once the process is complete, the market will return to its stable level and continue in its real direction (bullish or bearish). If the big drop was technically driven, we would have seen much lower prices. But it was actually a congress-induced Bear Fakeout. Too bad they misjudged the market's potential. LET THE MARKET MOVE ON ITS OWN WEIGHT (you can only hold a coiled spring down so long till you let go).
You don't have to agree with my opinion. We can agree to disagree. At least we have something in common i.e to make money. So just look at the charts and forget this crap i'm saying if you don't agree.

SPX-WEEKLY

SPX-DAILY LONGER TIMEFRAME

SPX-DAILY

SPX-30MIN LONGER TIMEFRAME

SPX-30MIN SHORTER TIMEFRAME

Thursday, October 27, 2011

TBT UPDATE & SPX

TBT-DAILY POSTED THURSDAY OCTOBER 20TH

TBT-DAILY UPDATE

SPX-DAILY

SPX-30MIN LONGER TIMEFRAME

SPX-30MIN SHORTER TIMEFRAME

SPX-5MIN

Wednesday, October 26, 2011

SPX

WARNING WARNING WARNING:
Although the SPX setup remains bullish, there is a bearish setup that is now in the works. At the moment it is not important. But a move below 1226 (aggressive) or 1220 (conservative) will likely lead to a fast drop. Will be dealt with at the appropriate time. To invalidate this bearish formation, the SPX needs to continue higher tomorrow (and possibly Friday)
Note: No 5min chart today (nothing special).

SPX-DAILY

SPX-30MIN LONGER

SPX-30MIN SHORTER

Tuesday, October 25, 2011

SPX

I do not have any clear play setup (bullish or bearish) for tomorrow's trading (see the 5min chart for an aggressive setup). At the moment the bulls are still control. Today's drop is a bull pullback. The question now is whether the pullback is over to complete wave 2 black (see my daily chart) or whether it starts the day lower and then makes a reversal back higher.
NOTE: Trade above 1257 will lead to a strong push higher.

SPX-DAILY

SPX-30MIN LONGER TIMEFRAME

SPX-30MIN SHORTER TIMEFRAME

SPX-5MIN

Monday, October 24, 2011

SPX (WEEKLY, DAILY, 30MIN x2 & 5MIN CHARTS)

A weekly chart is included with this post because I added a trendline that is reflecting in the DAILY and 30MIN LONGER TIMEFRAME charts that will very likely come into play this week and could be significant in terms of determining the pullback point before the SPX resumes its upside move.
It's looking like a pullback will start on Wednesday after an initial move higher to about 1280 at the start of the day before reversing lower.

SPX-WEEKLY

SPX-DAILY

SPX-30MIN LONGER TIMEFRAME

SPX-30MIN SHORTER TIMEFRAME

SPX-5MIN

Saturday, October 22, 2011

SPX WEEKEND REVIEW

A 5min chart has been added for daytrading or quicker entry and exit.
Note: Though unlikely, any changes I decide to make on the charts will be done so by 9am EST (New York time) Sunday. I will make no changes after that time.

SPX-WEEKLY

SPX-DAILY

SPX-30MIN LONGER TIMEFRAME

SPX-30MIN SHORTER TIMEFRAME

SPX-5MIN

Thursday, October 20, 2011

SPX & TBT (Ultrashort 20yr Treasury)

This is decision time for the market. We are very likely to see a decisive move one way or the other tomorrow (or Monday). There is no more room for the market to hide in its high base consolidation Diamond Pattern. The breakout is in favor of the bulls at the moment, but be ready for a big move in any direction.

SPX-DAILY

SPX-30MIN LONGER TIMEFRAME

SPX-30MIN SHORTER TIMEFRAME

TBT(ultrashort 20yr Treasury)-DAILY
Tends to move in the same direction with the market as oppose to the TLT (20yr Bond) which moves opposite to the TBT and tends to move opposite to the mkt. Can also use this chart to make decisions with the TLT.

Wednesday, October 19, 2011

S&P 500

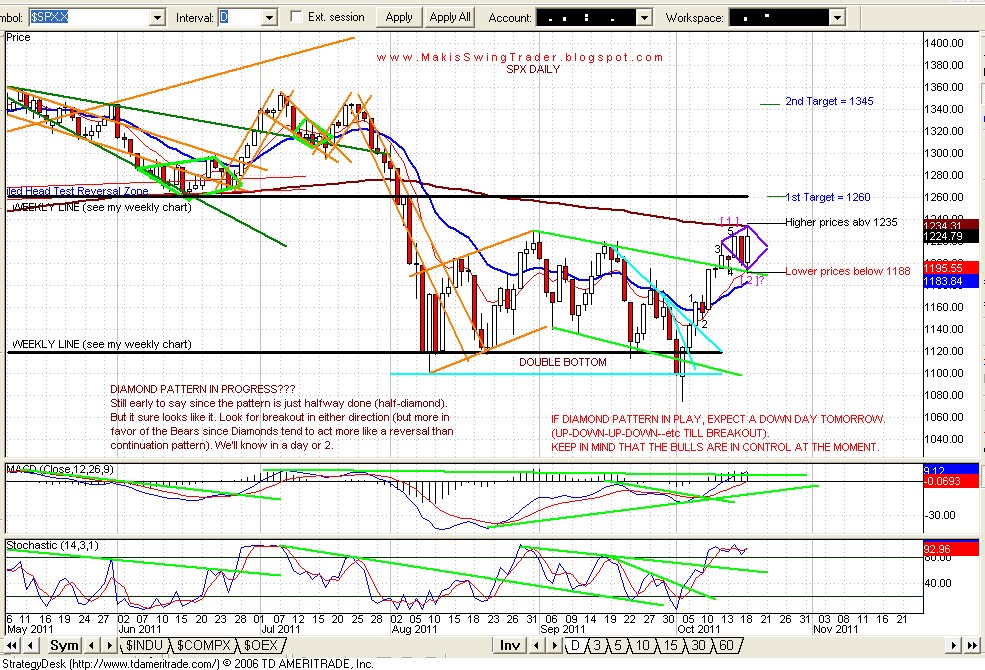
The market is consolidating for a big move one way or the other. Yesterday, there was a mismatch between daily and 30min charts. The daily was pointing to a down day today (based on the Diamond Pattern) but the 30min chart was indicating a possible rise.
Today, the daily chart is indicating an up day tomorrow after an initial small down move at the open, but not indicating a move above today's high (1229.64) or open(1223.46) base on the Diamond Pattern (unless it's a break out of the pattern for more push up).
On the other hand, the 30min chart is pointing to an up day without the initial drop (unless it's setting up as a bear fakeout). It's also pointing to a rise above today's open and high.
Advantage goes to the Daily chart because the Daily trumps Intraday. But that does mean much since the Daily can follow the intraday as a breakout.
It drives me crazy when my charts are not all pointing in one direction. Oh well.
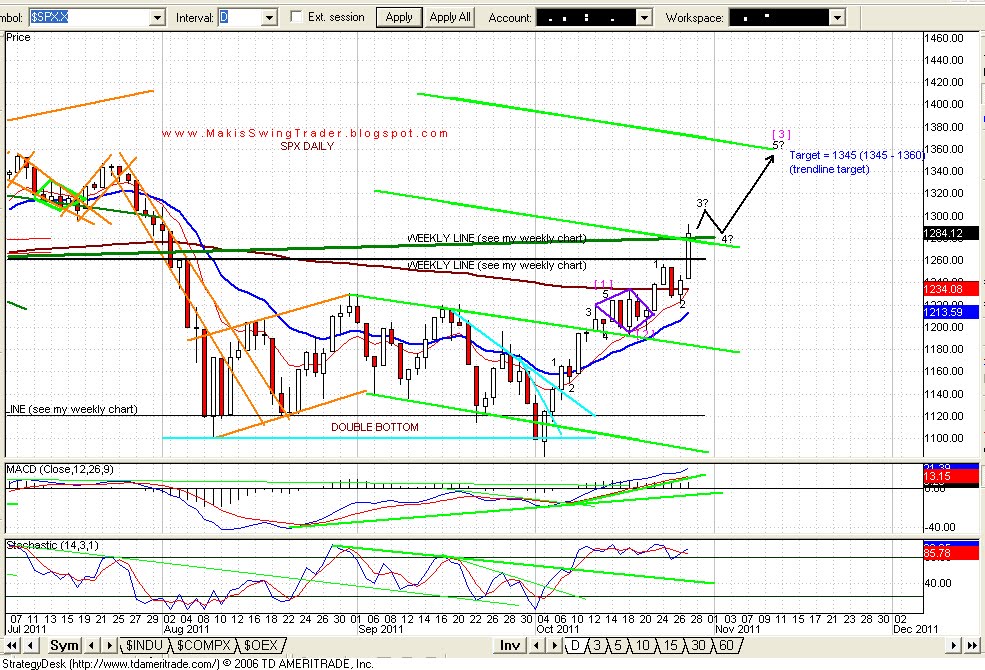
SPX-DAILY

SPX-30MIN LONGER TIMEFRAME

SPX-30MIN SHORTER TIMEFRAME

Tuesday, October 18, 2011

SPX

SPX-DAILY

SPX-30MIN LONGER TIMEFRAME

SPX-30MIN SHORTER TIMEFRAME

Monday, October 17, 2011

S&P

I believe there will be a Hammer candlestick on the SPX daily chart tomorrow i.e a drop in the first half of the day and recovery in the 2nd half that continues higher on Wednesday and then a drop on Thursday. This scenario is very likely as long as SPX stays below 1227. Move above 1227 will be an indication of the next leg higher.
So look for sideways action the next few days which will setup a bull run after wave 2 is complete and the Bull Flag Pattern breaks out higher.
Note that sideways action are great for daytrading. Take advantage of the opportunity if it presents itself.
Keep in mind that I trade the charts not my beliefs.

SPX-DAILY

SPX-30MIN LONGER TIMEFRAME

SPX-30MIN SHORTER TIMEFRAME

Saturday, October 15, 2011

SPX WEEKEND REVIEW

SPX-WEEKLY

SPX-DAILY

SPX-30MIN LONGER TIMEFRAME

SPX-30MIN SHORTER TIMEFRAME

Thursday, October 13, 2011

S&P 500

SPX-DAILY

SPX-30MIN LONGER TIMEFRAME

SPX-30MIN SHORTER TIMEFRAME